Operations
For spatial operations we use the native Julia package GeometryOps.jl, which is imported automatically.
Geometric operations
GeometryOps.intersects.(df.geometry, df.geometry[1]);
10-element BitVector:
 1
 0
 0
 0
 0
 0
 0
 0
 0
 0
To get the previous behaviour for ArchGDAL geometries and operations, you can use the GeoInterface operation (also imported automatically), which uses the (Arch)GDAL operations under the hood. Note that this will not work for files loaded from GeoJSON, GeoParquet, or FlatGeobuf, as they are not supported by ArchGDAL.
df.geometry = GeoInterface.buffer.(df.geometry, 10)  # points turn into polygons
10×2 DataFrame
 Row │ geometry              name
     │ IGeometr…             String
─────┼──────────────────────────────
   1 │ Geometry: wkbPolygon  test
   2 │ Geometry: wkbPolygon  test
   3 │ Geometry: wkbPolygon  test
   4 │ Geometry: wkbPolygon  test
   5 │ Geometry: wkbPolygon  test
   6 │ Geometry: wkbPolygon  test
   7 │ Geometry: wkbPolygon  test
   8 │ Geometry: wkbPolygon  test
   9 │ Geometry: wkbPolygon  test
  10 │ Geometry: wkbPolygon  test
Reprojection
Reproject uses GeometryOps, except for ArchGDAL geometries, to reproject geometries. We use GeoFormatTypes.jl to specify the coordinate reference system (CRS) of the geometries. The CRS can be specified in several ways, including EPSG codes, PROJ strings, and WKT strings.
dfr = GeometryOps.reproject(df, EPSG(4326), EPSG(28992))
10×2 DataFrame
 Row │ geometry                  name
     │ Tuple…                    String
─────┼──────────────────────────────────
   1 │ (-5.85314e5, -5.70947e6)  test
   2 │ (-4.93872e5, -5.63219e6)  test
   3 │ (-4.90248e5, -5.60829e6)  test
   4 │ (-5.83703e5, -5.65952e6)  test
   5 │ (-5.64684e5, -5.67049e6)  test
   6 │ (-5.23958e5, -5.6656e6)   test
   7 │ (-5.10669e5, -5.69072e6)  test
   8 │ (-5.44627e5, -5.71647e6)  test
   9 │ (-4.53527e5, -5.72909e6)  test
  10 │ (-458280.0, -5.72039e6)   test
Note that by using GeometryOps, point geometries are reproject to a tuple of coordinates, which is treated as a valid Point geometry as well.
Plotting
Plotting will work out of the box with Plots and Makie.
Plots.jl
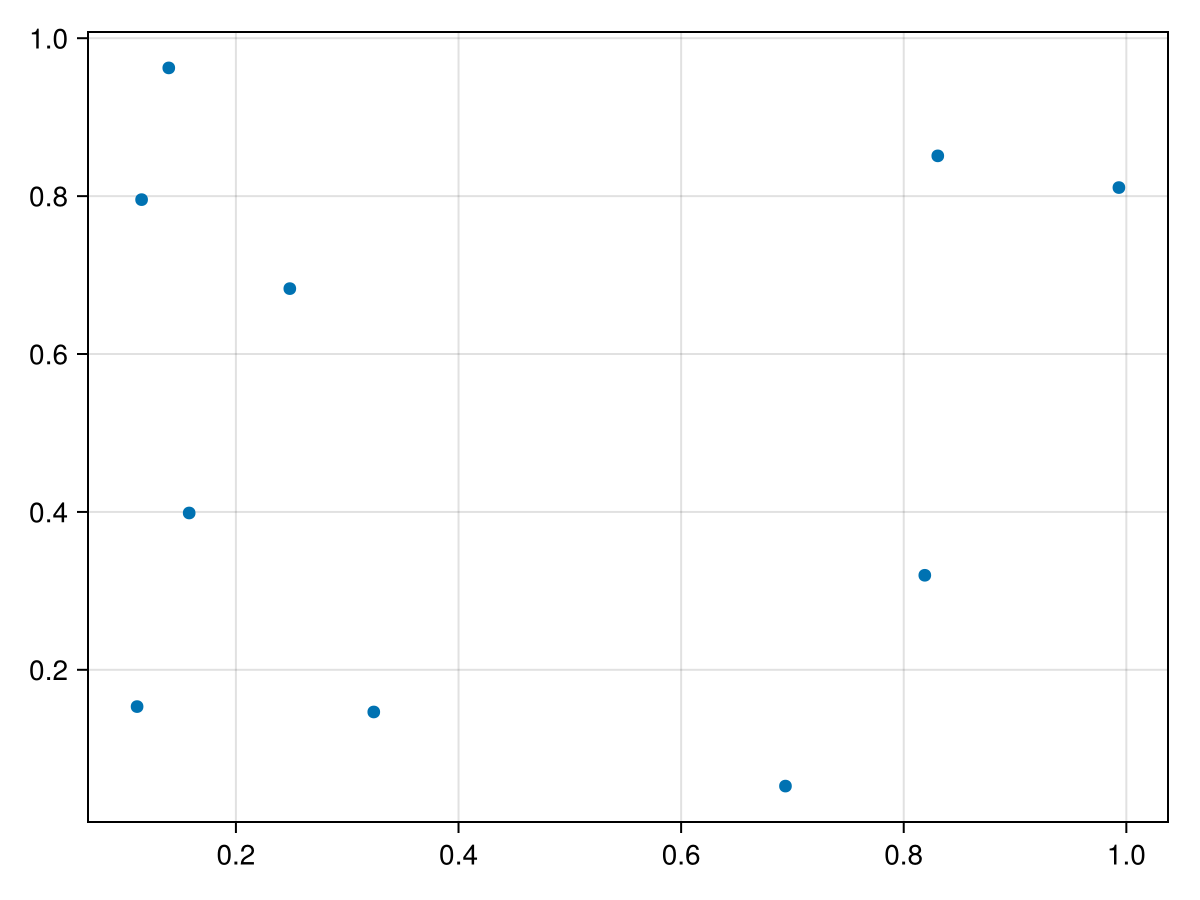
using Plots
plot(df.geometry)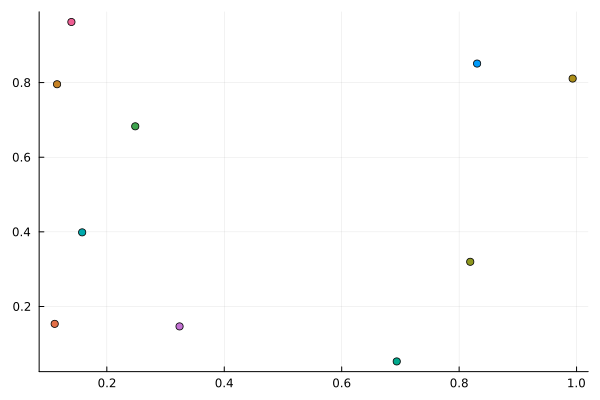
Makie
using CairoMakie
plot(df.geometry)