Plot geometries
Pass a GeoInterface geometry column to CairoMakie to make a quick spatial plot.
Plot a deterministic table
julia
using CairoMakie
using GeoDataFrames
using GeoDataFrames: setcrs!
using NaturalEarth

countries = select(
    DataFrame(naturalearth("admin_0_countries", 10)),
    :NAME,
    :geometry,
)

plot(
    countries.geometry;
    color = :lightgray,
    strokecolor = :gray,
    axis = (; title = "Natural Earth countries"),
)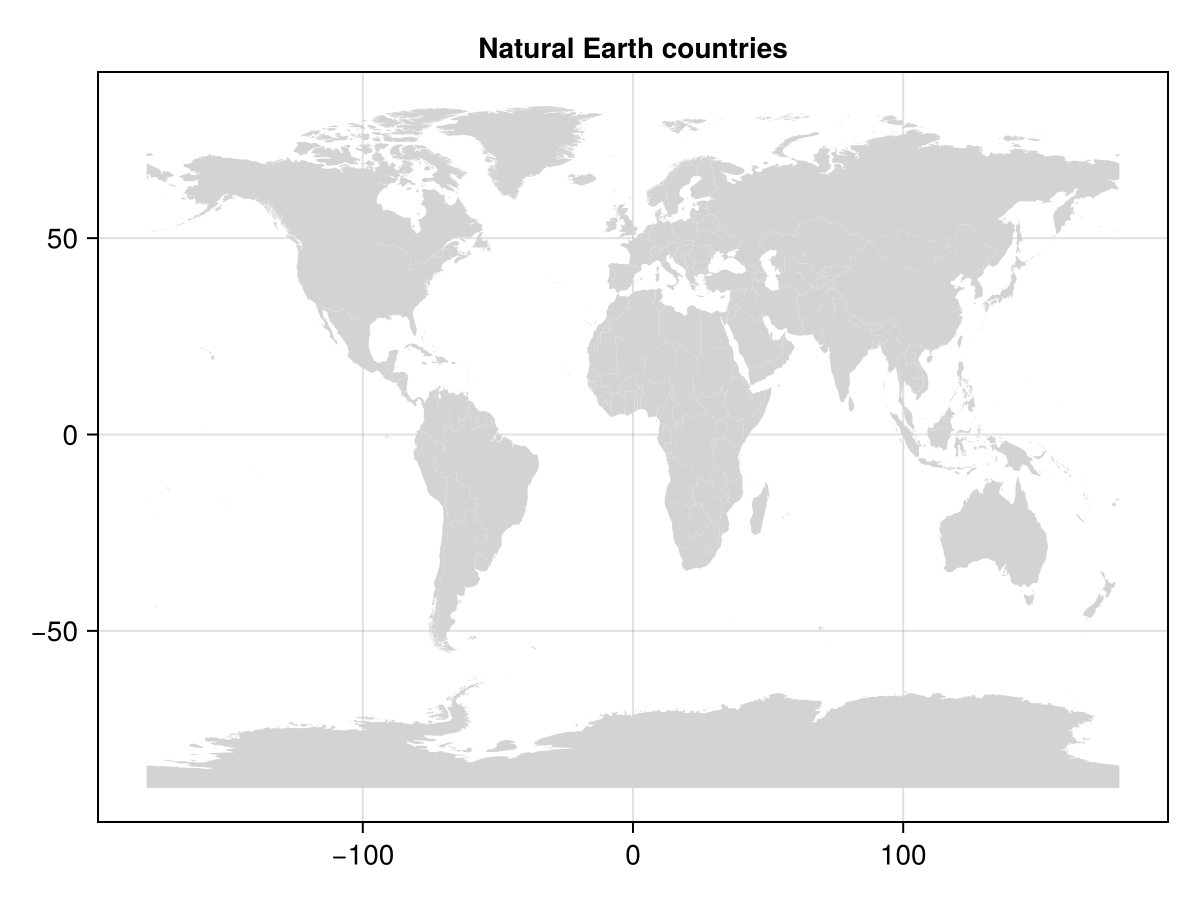
The result is a CairoMakie figure with country polygons. Reproject first when the map needs a projected CRS; see reproject and reproject data.
Plot layered lines and polygons
julia
rivers = select(
    DataFrame(naturalearth("rivers_lake_centerlines", 10)),
    :name_en,
    :geometry,
)
cities = select(
    DataFrame(naturalearth("populated_places", 50)),
    :NAME,
    :geometry,
)

region_names = [
    "Austria",
    "Bulgaria",
    "Croatia",
    "Czechia",
    "Germany",
    "Hungary",
    "Moldova",
    "Romania",
    "Serbia",
    "Slovakia",
    "Ukraine",
]
regional_countries = subset(
    countries,
    :NAME => ByRow(name -> name in region_names),
)
danube = subset(rivers, :name_en => ByRow(isequal("Danube")))
regional_cities = subset(
    cities,
    :NAME => ByRow(
        name -> name in [
            "Belgrade",
            "Berlin",
            "Bratislava",
            "Bucharest",
            "Budapest",
            "Kyiv",
            "Prague",
            "Sofia",
            "Vienna",
            "Zagreb",
        ],
    ),
)

fig = plot(
    regional_countries.geometry;
    color = (:lightgray, 0.45),
    strokecolor = :gray,
    axis = (; title = "Countries, the Danube, and cities"),
)
plot!(danube.geometry; color = :dodgerblue, linewidth = 3)
plot!(regional_cities.geometry; color = :tomato, markersize = 10)
fig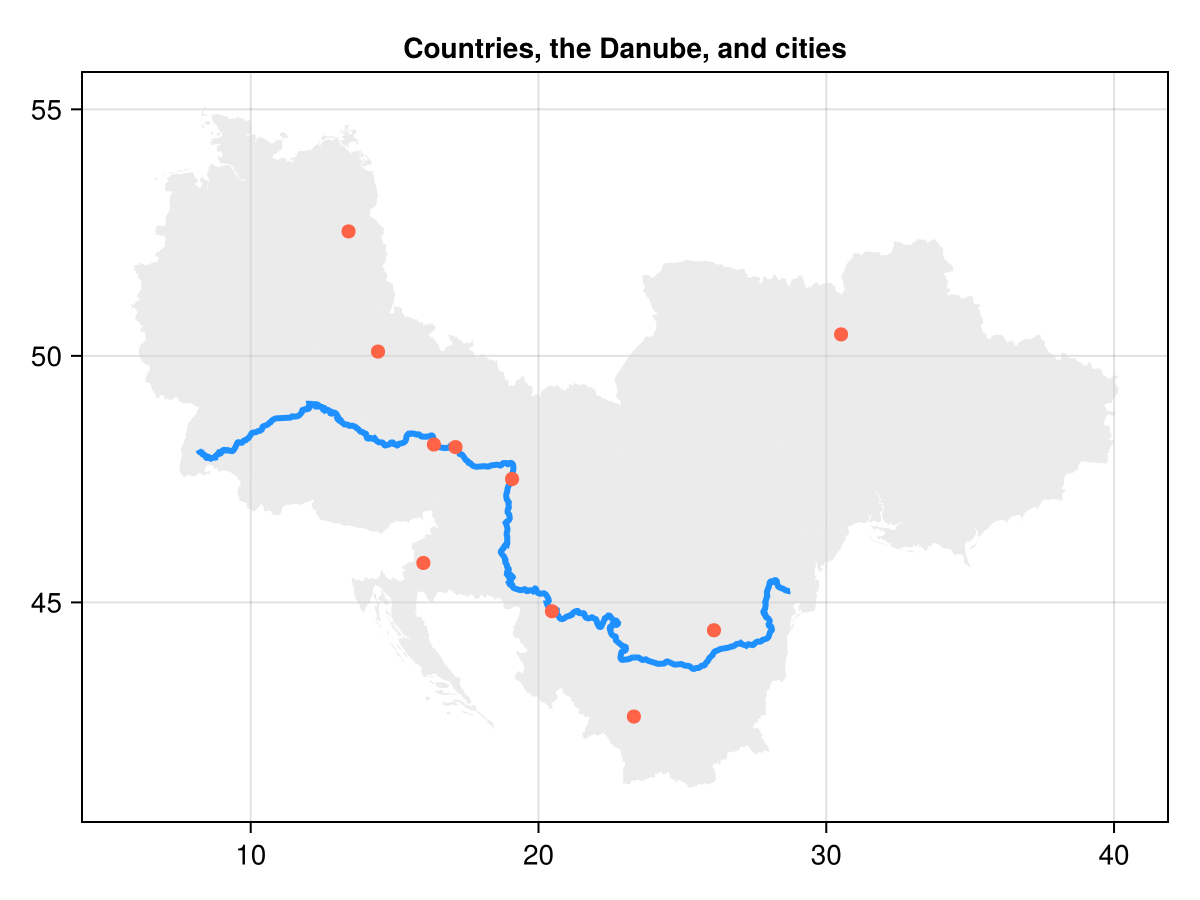
GeoInterface supplies the geometry integration. For layouts, axes, themes, colour scales, interactivity, and output formats, use the Makie documentation.