From scratch
Here we create a GeoDataFrame from scratch with several nearby European locations, set their coordinate reference system (CRS), save and reload them, and project them for mapping and plotting.
Create locations and declare their CRS
The coordinates below use longitude, latitude order in WGS 84. setcrs! records that fact as table metadata; it does not change any coordinates.
using GeoDataFrames
using GeoDataFrames: setcrs!

places = DataFrame(
    name = ["Amsterdam", "Rotterdam", "Brussels", "Cologne"],
    geometry = GeoInterface.Point.([
        (4.8952, 52.3702),
        (4.4777, 51.9244),
        (4.3517, 50.8503),
        (6.9603, 50.9375),
    ]),
)
setcrs!(places, EPSG(4326))| Row | name | geometry |
|---|---|---|
| String | Point… | |
| 1 | Amsterdam | Point((4.8952,52.3702)) |
| 2 | Rotterdam | Point((4.4777,51.9244)) |
| 3 | Brussels | Point((4.3517,50.8503)) |
| 4 | Cologne | Point((6.9603,50.9375)) |
Julia displays a four-row table. Its :geometry column contains points, and its CRS is now EPSG:4326. For other geometry columns or CRS metadata, see manage geometry metadata.
Save and load the table
We can write the DataFrame to a GeoPackage in a temporary directory, then read it back. The do block removes the directory after the read completes.
stored_places = mktempdir() do directory
    path = joinpath(directory, "places.gpkg")
    GeoDataFrames.write(path, places)
    GeoDataFrames.read(path)
end

(names = names(stored_places), crs = GeoInterface.crs(stored_places))
(names = ["fid", "geometry", "name"], crs = WellKnownText{GeoFormatTypes.CRS}(GeoFormatTypes.CRS(), "GEOGCS[\"WGS 84\",DATUM[\"WGS_1984\",SPHEROID[\"WGS 84\",6378137,298.257223563,AUTHORITY[\"EPSG\",\"7030\"]],AUTHORITY[\"EPSG\",\"6326\"]],PRIMEM[\"Greenwich\",0,AUTHORITY[\"EPSG\",\"8901\"]],UNIT[\"degree\",0.0174532925199433,AUTHORITY[\"EPSG\",\"9122\"]],AXIS[\"Latitude\",NORTH],AXIS[\"Longitude\",EAST],AUTHORITY[\"EPSG\",\"4326\"]]"))The result lists name and geometry, with the stored CRS. For layers, drivers, remote paths, and file options, see read and write vector data.
Project coordinates for a map
Web Mercator uses metre-like projected coordinates. reproject returns a new table, leaving stored_places in EPSG:4326.
projected_places = reproject(stored_places, EPSG(3857))

(original_crs = GeoInterface.crs(stored_places), projected_crs = GeoInterface.crs(projected_places))
(original_crs = WellKnownText{GeoFormatTypes.CRS}(GeoFormatTypes.CRS(), "GEOGCS[\"WGS 84\",DATUM[\"WGS_1984\",SPHEROID[\"WGS 84\",6378137,298.257223563,AUTHORITY[\"EPSG\",\"7030\"]],AUTHORITY[\"EPSG\",\"6326\"]],PRIMEM[\"Greenwich\",0,AUTHORITY[\"EPSG\",\"8901\"]],UNIT[\"degree\",0.0174532925199433,AUTHORITY[\"EPSG\",\"9122\"]],AXIS[\"Latitude\",NORTH],AXIS[\"Longitude\",EAST],AUTHORITY[\"EPSG\",\"4326\"]]"), projected_crs = EPSG{1}((3857,)))The result reports EPSG:4326 for the original table and EPSG:3857 for the new one. See reproject data before transforming larger datasets.
Apply a geometry operation
GeometryOps predicates work on the GeoInterface geometries in the column. Load the Netherlands boundary, project it to the same CRS as the places, and retain only locations that intersect it.
using NaturalEarth

map_units = select(
    DataFrame(naturalearth("admin_0_map_units", 10)),
    :NAME,
    :geometry,
)

netherlands = subset(map_units, :NAME => ByRow(==("Netherlands")))
projected_netherlands = reproject(netherlands, EPSG(3857))

country = only(projected_netherlands.geometry)
selected = subset(
    projected_places,
    :geometry => ByRow(geometry -> intersects(geometry, country)),
)

selected.name
2-element Vector{String}:
"Amsterdam"
"Rotterdam"The selected names are "Amsterdam" and "Rotterdam". See apply geometry operations for predicates and transformations on areas and other geometry types.
Plot the points
Makie recognizes GeoInterface geometries. The final expression shows all four projected points and highlights the two locations in the Netherlands.
using CairoMakie  # or GLMakie

fig = plot(
    projected_netherlands.geometry;
    color = (:dodgerblue, 0.15),
    strokecolor = :dodgerblue,
    axis = (; title = "Locations in the Netherlands"),
)
plot!(projected_places.geometry; color = :lightgray, markersize = 14)
plot!(selected.geometry; color = :tomato, markersize = 14)
fig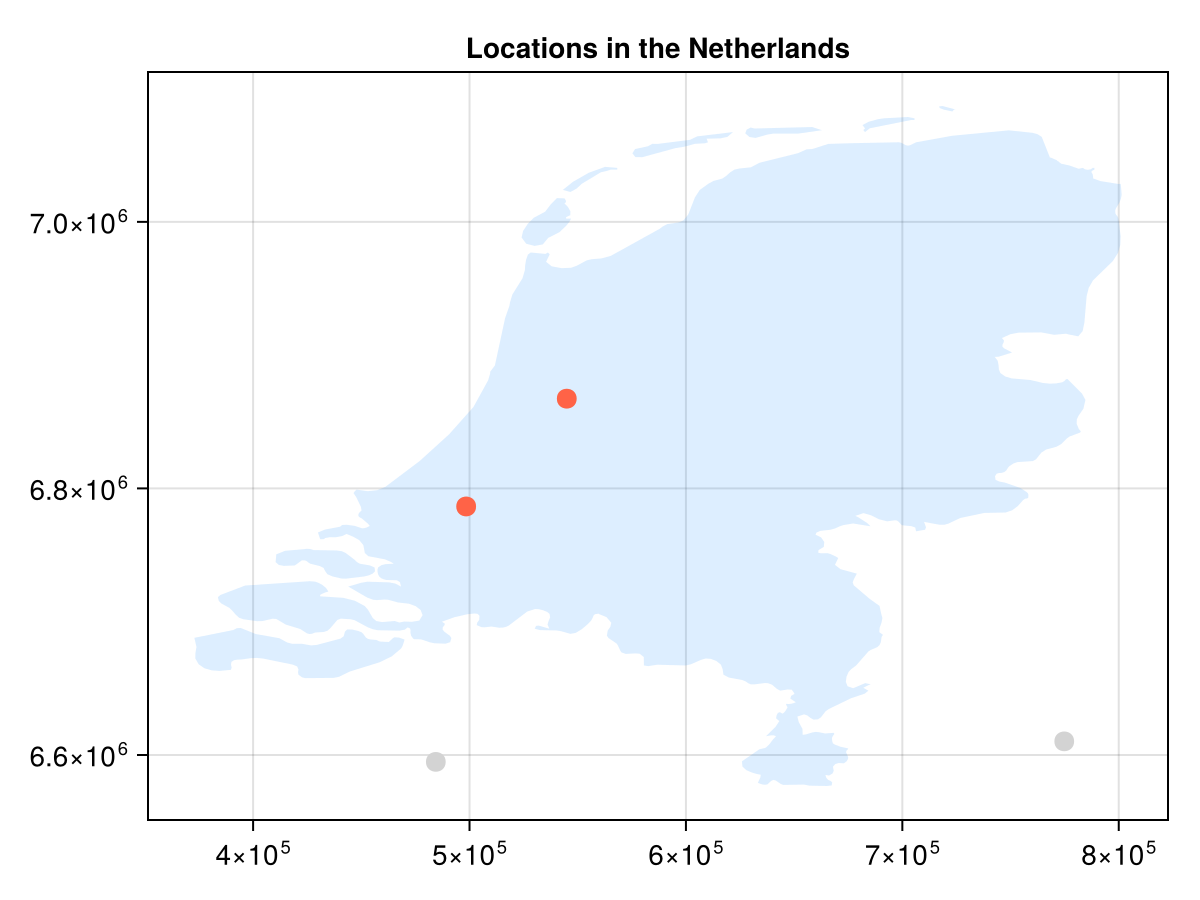
For axes, colours, labels, and other presentation choices, start with plot geometries and then consult Makie's documentation.